
WIRELESS+DATA
WIFI & VBLE
As digital director for the project, wireless network deployment and MSP management were never intended projects to fall within my scope. While researching and bidding for BLE (Bluetooth Low Energy) beacons for indoor location services, I had a strong belief that the available technology was glaringly antiquated, all of which still were battery powered tags that affixed to surfaces by adhesive. The hardware density and signal life posed incredible operating cost implications and great reliability concerns.
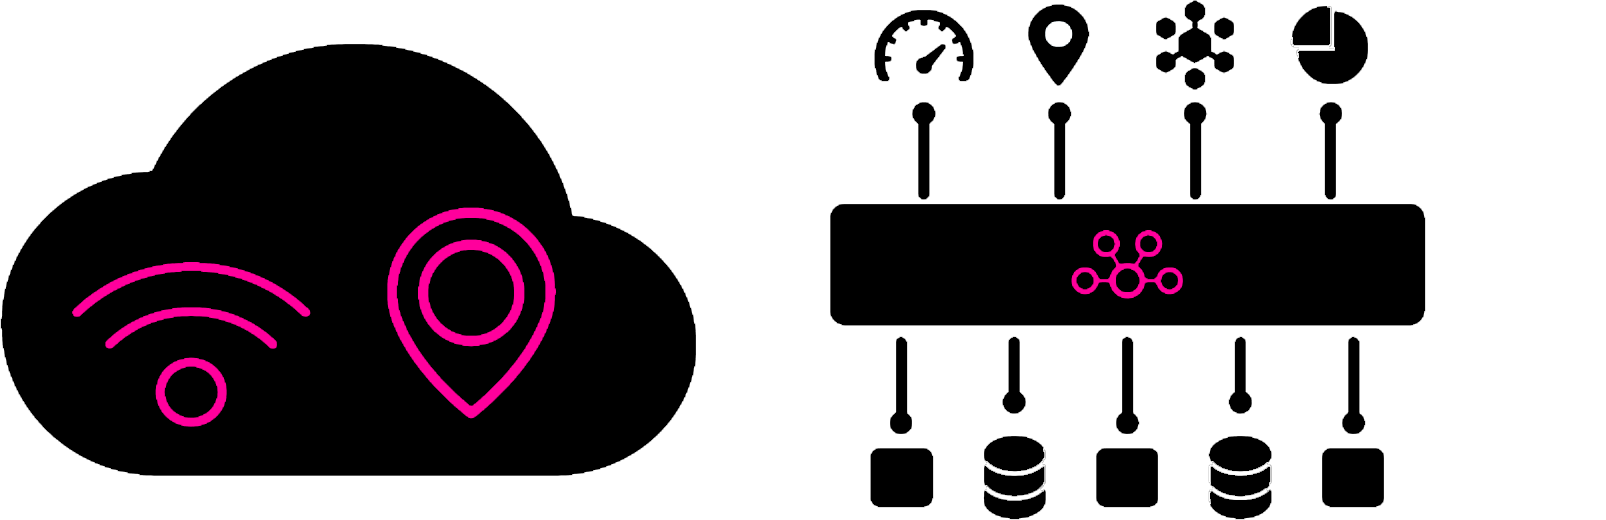
Following Cisco Live 2015, I read a press release about Mist Systems, a cloud-based wireless networking startup from a consortium of Silicon Valley veterans, and now the first virtual BLE (vBLE) provider. Mist utilized a Bluetooth radio in a wired access point to create Bluetooth signal field within a space, allowing for "beacons" to be placed anywhere throughout a facility for proximity messaging and services, as well as hyper-local blue dot.
FROM MIST| "Mist has built a wireless platform from the ground up to deliver smart wireless services for the smart device era. With advanced features like machine learning, analytics, event correlation, dynamic packet capture and high accuracy location services, Mist provides a user-first approach to wireless that simplifies operations and delivers a superior experience for wireless users."
I was highly confident that this startup has created a technology that would redefine the industry, so I cancelled the existing wireless contract and partnered with Mist for Wi-Fi and vBLE in the mall.
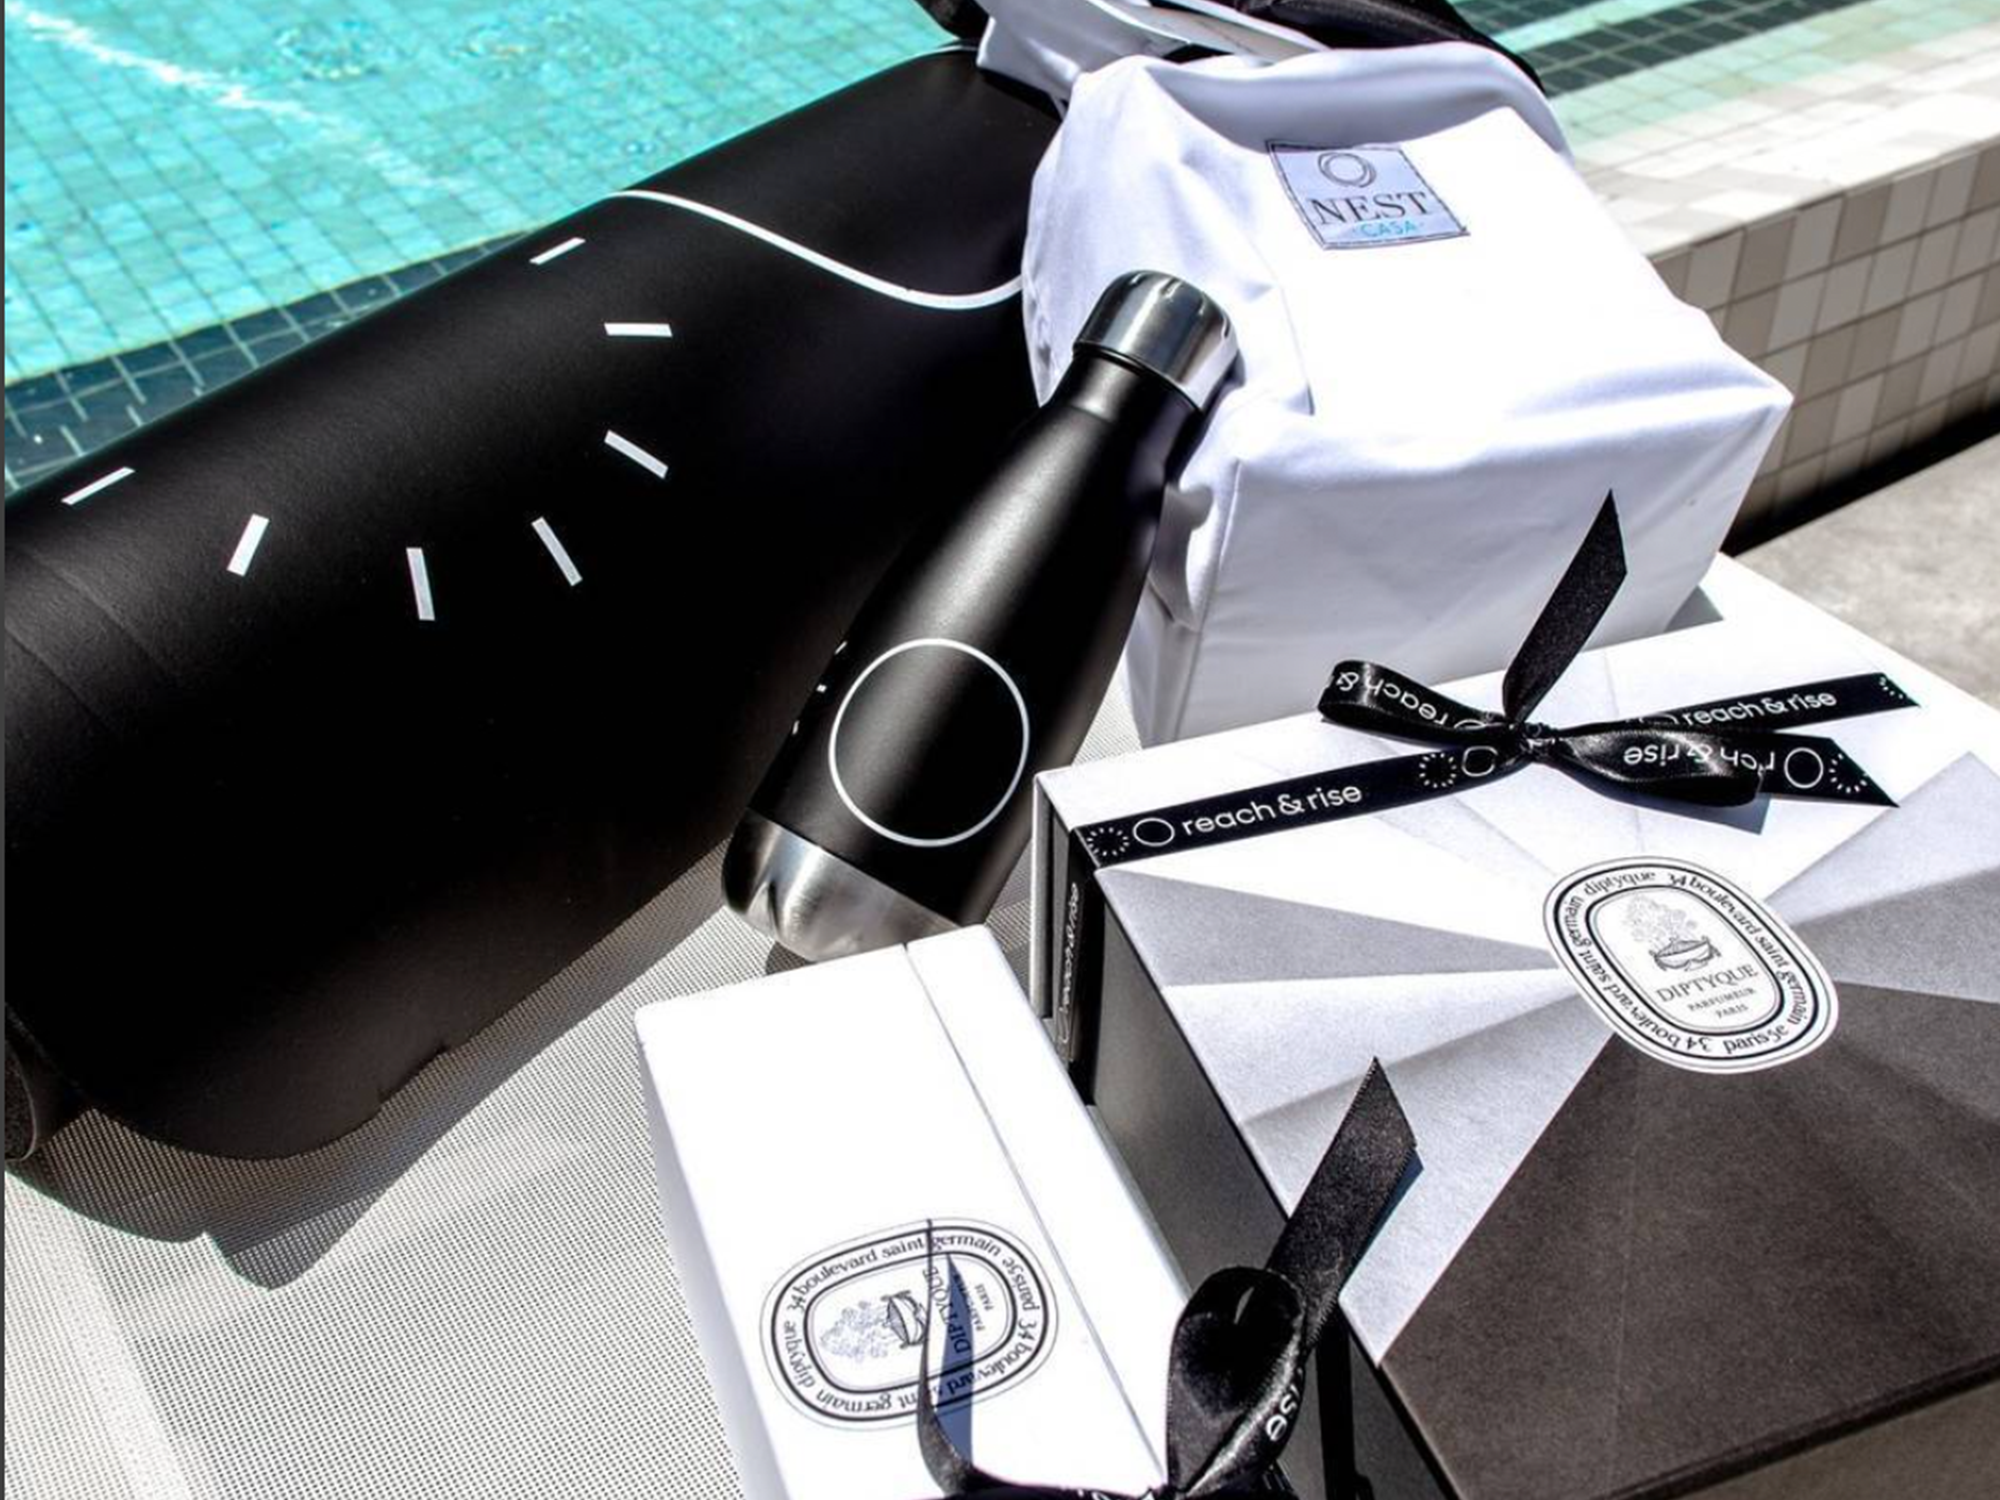
Throughout the deployment, I worked with Mist and Hotwire Communications, the MSP for the project, to identify the locations for all of the hardware, created the deployment and installation plans, and oversaw the execution of the installation. We used a 3M wrap to blend the hardware aesthetic into the lamboo ceilings.
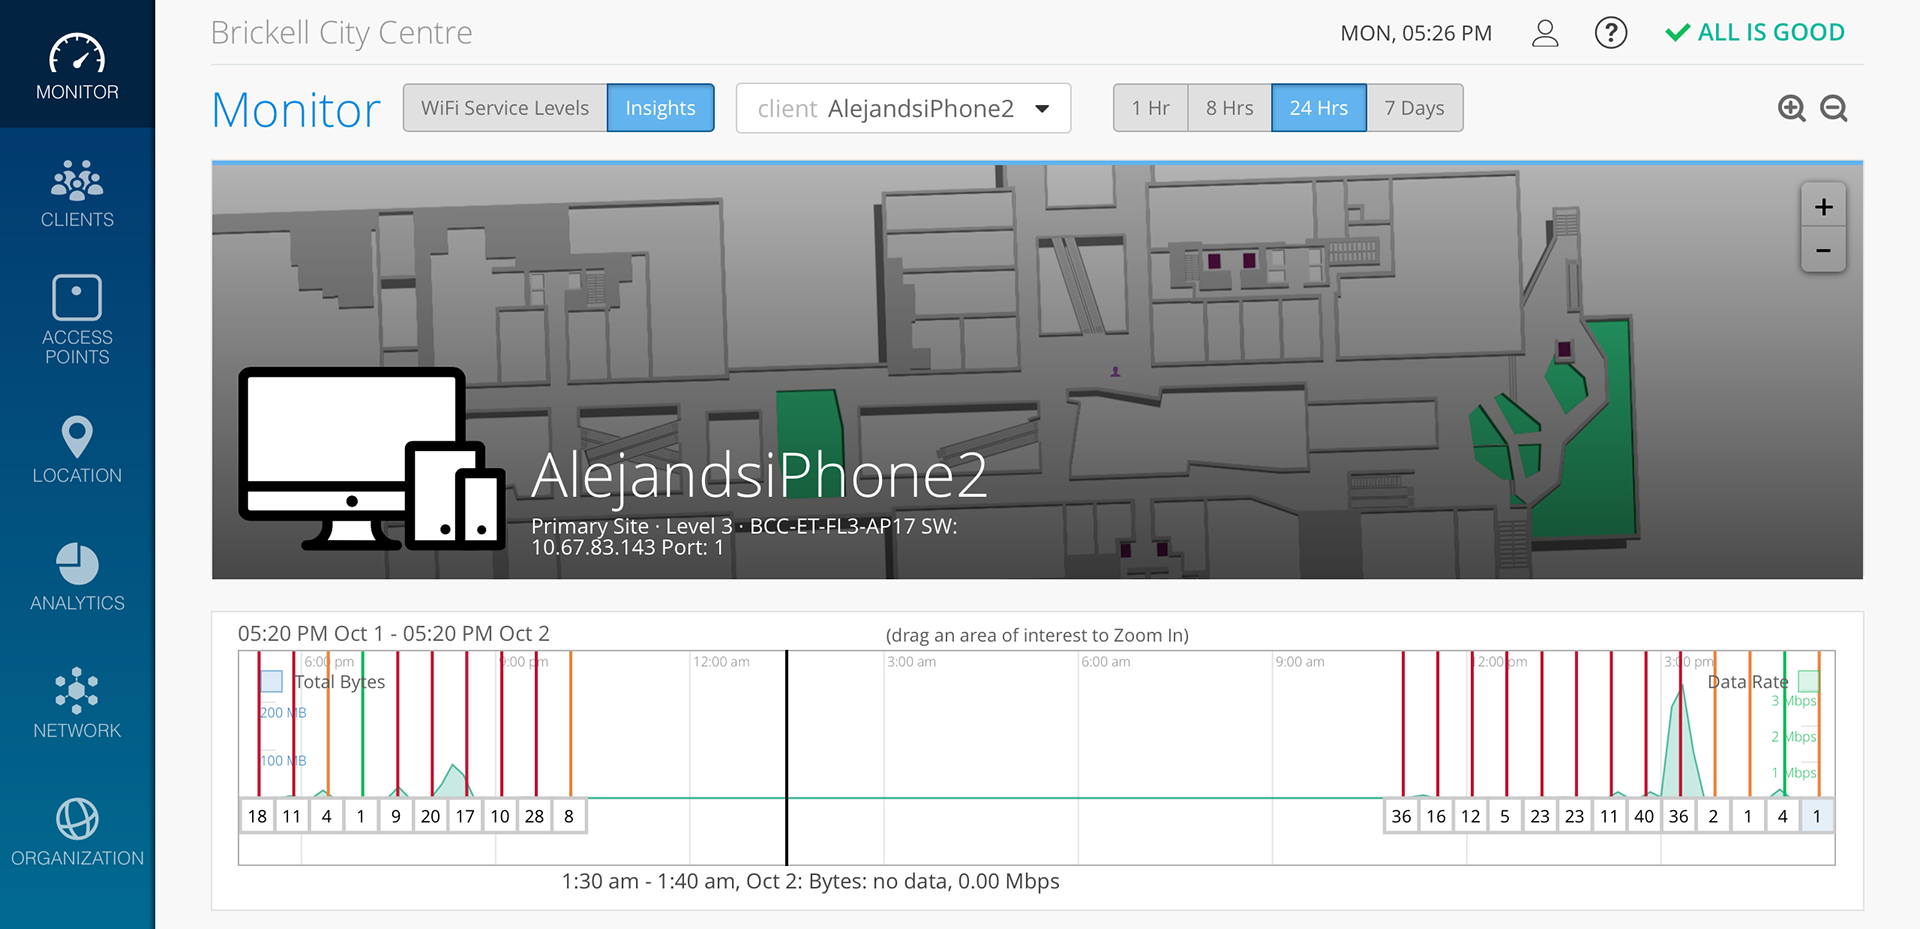
The network development included 90 AP-41 units (Wi-Fi & vBLE) and 40 BT-11 (vBLE) units. The Wi-Fi performance once tuned and with Mist's patented band steering, which forces 5G enabled devices to a 1,730 Mbps throughput, consistently speed tested between 100 and 200 Mbps in common areas.
The vBLE for location accuracy is a more difficult piece and was a collaboration with app location technology, was achieving a majority location accuracy of sub 3 meters and sub-second latency.
Bob Friday, Mist CTO, discussing our deployment at Technology Field Day.
Vistor Data
ACTIVE & PASSIVE
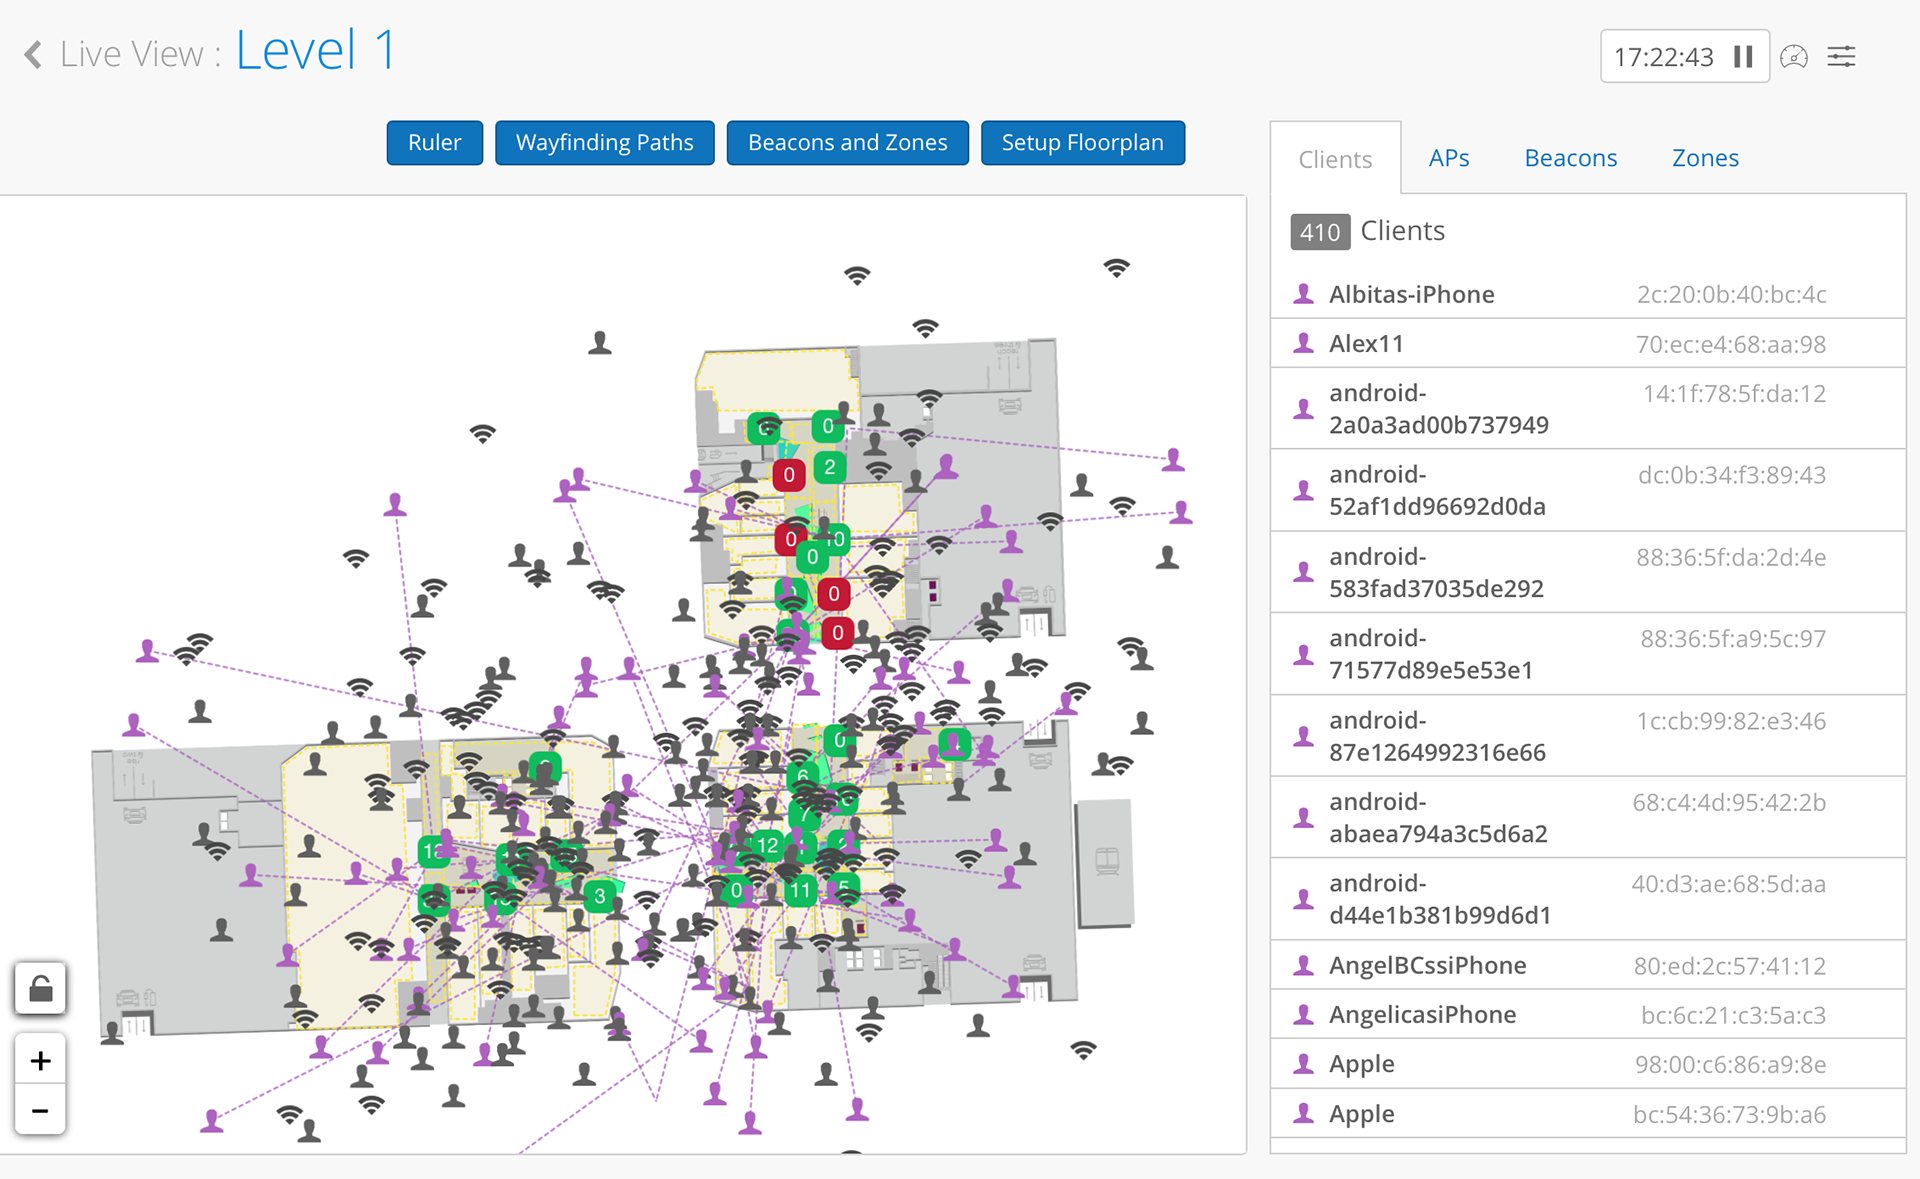
By utilizing the Mist Cloud analytics, packet capture and machine learning capabilities, we were able to solve the problem of tracking and accounting for passive visitors, or the visitors that don't have the application downloaded and have not connected to the Wi-Fi network.
Since Brickell City Centre retail had approximately 25 different means of ingress and egress, with multiple corridor width pedestrian entrances and pedestrian bridges over 2 main downtown intersections, noise filtering, or developing the business logic to identify real visitors vs. passing devices was a major task. To achieve our greatest visitation accuracy, we used "choke points" or signal threshold parameters in points of ingress and egress, and set filtering parameters to negate devices that didn't achieve a minimum dwell (sidewalk and vehicle static) as well as first detections that would not be logical or feasible.
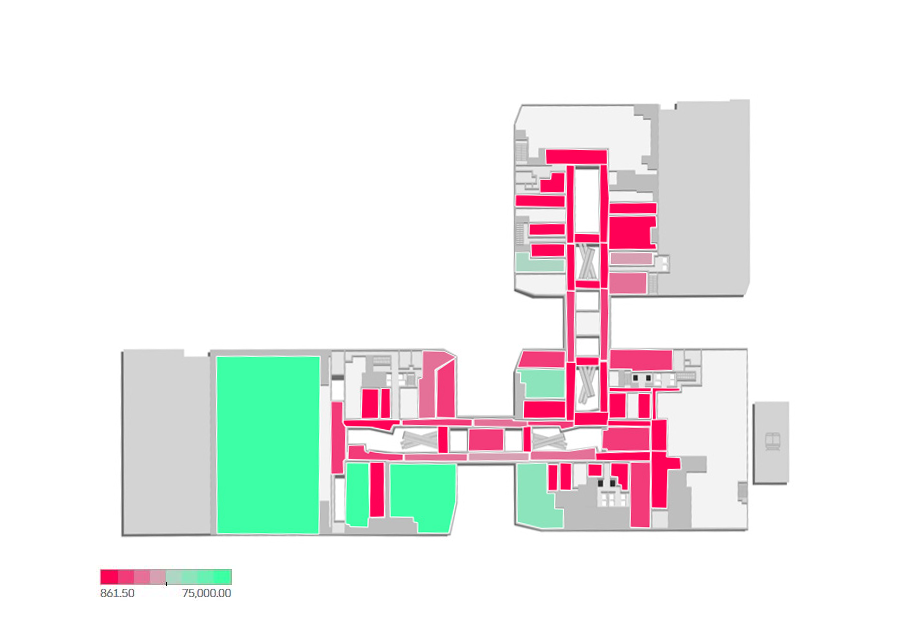
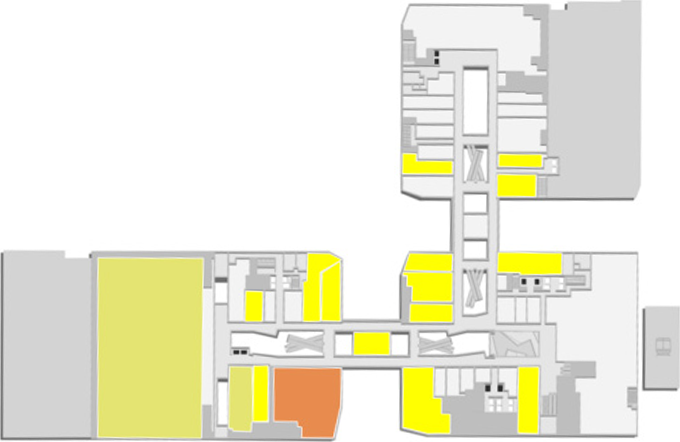
HEAT MAPPING & PATH ANALYSIS
To develop heat maps of how visitors interact within the space, we created zones to movement through zone entry and exit and calculated dwell times. If a zone near a restaurant, for instance, was a last point of detection, and 90 minutes later was once again a first point of detection, the dwell time calculation for last seen and first seen was the established visitation to that particular venue.
By utilizing the Mist Live API for location analytics, we ingested all of the raw data collected onsite into Python and ran the filtering programs to clean the data. From there, we connected the data from the cloud to Tableau desktop, where we ran analysis and used custom maps for traffic analysis by taking the latitude and longitude of the points that correlate the corners of each zone.
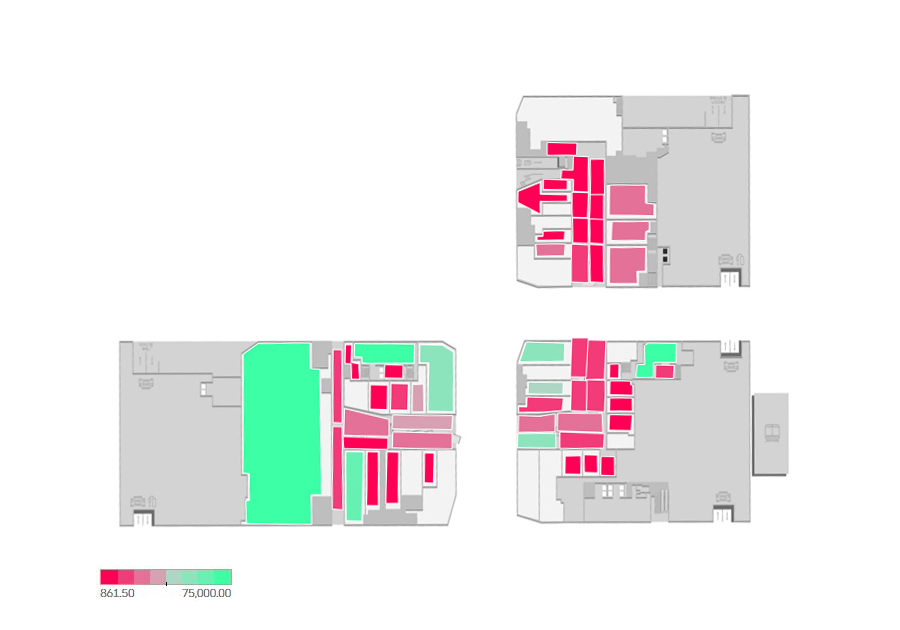
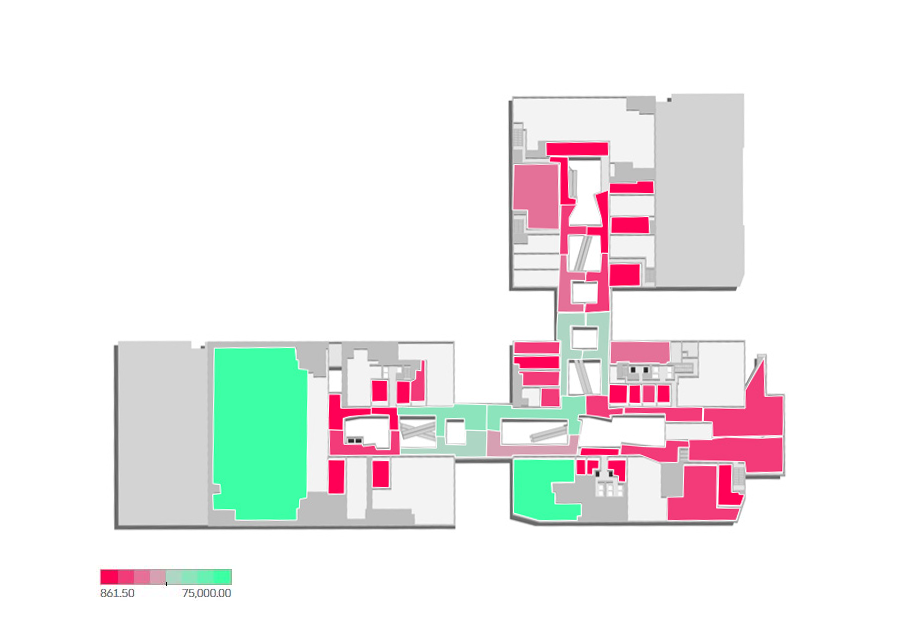
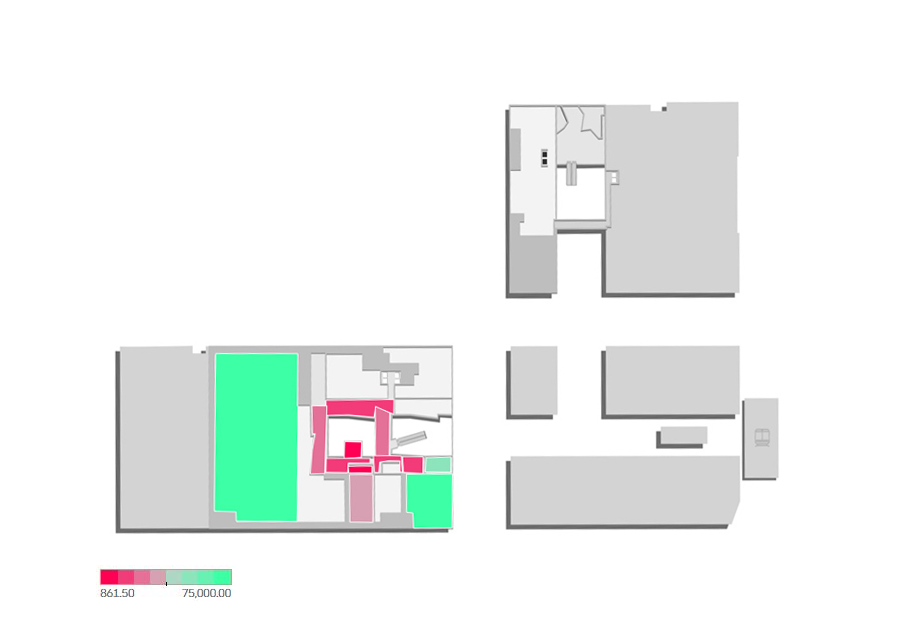
By utilizing business logic for specific location presence calculated against hour and frequency, we were able to ascertain which visitors were tenants of our office properties and analyze where that segment frequented and when.
Level Two Heatmap Analysis for Brickell City Centre Office Tenants
Business Intelligence
TABLEAU & DOMO
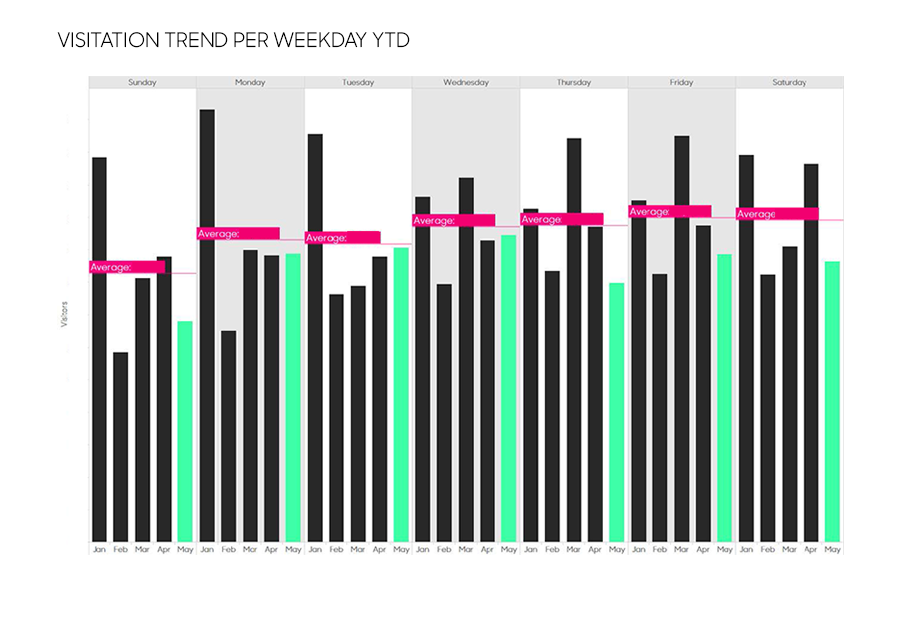
To analyze the onsite, web, app, SEM, call and other data for Brickell City Centre, I began with Tableau as the business intelligence platform for integration of different feeds using both hosted data and web data connectors. For monthly reporting I would connect to all data sources and would extract information for reporting, as the adoption for an online system over PDF reporting was a trial.
Tableau is a powerful system for analysts, but I found it to lack certain appeal from a marketing and reporting perspective, which ultimately would suit our needs more adequately. Prior to my exit, I was in process with a transition to a system called DOMO, developed by the creator of Omniture, now Adobe Analytics.
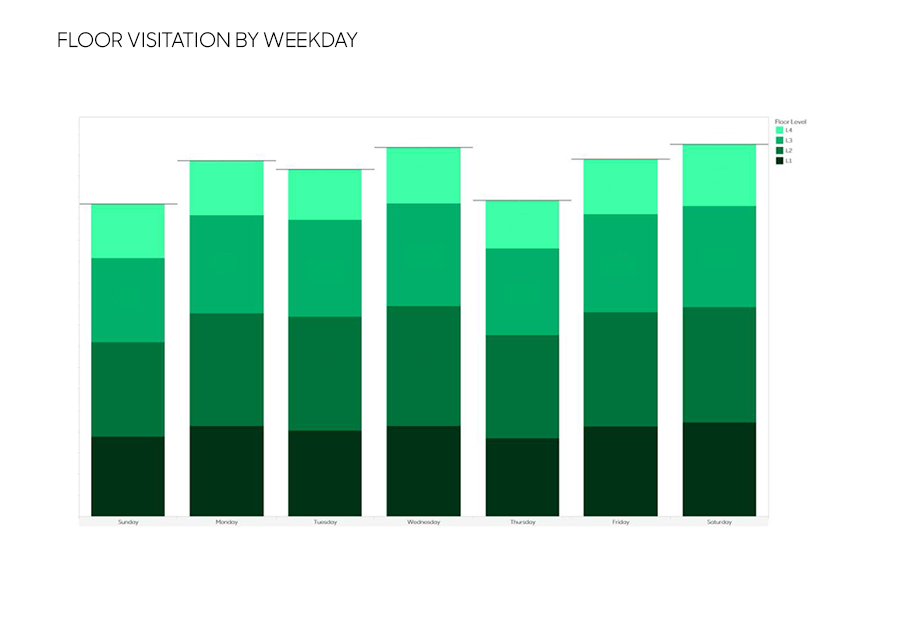
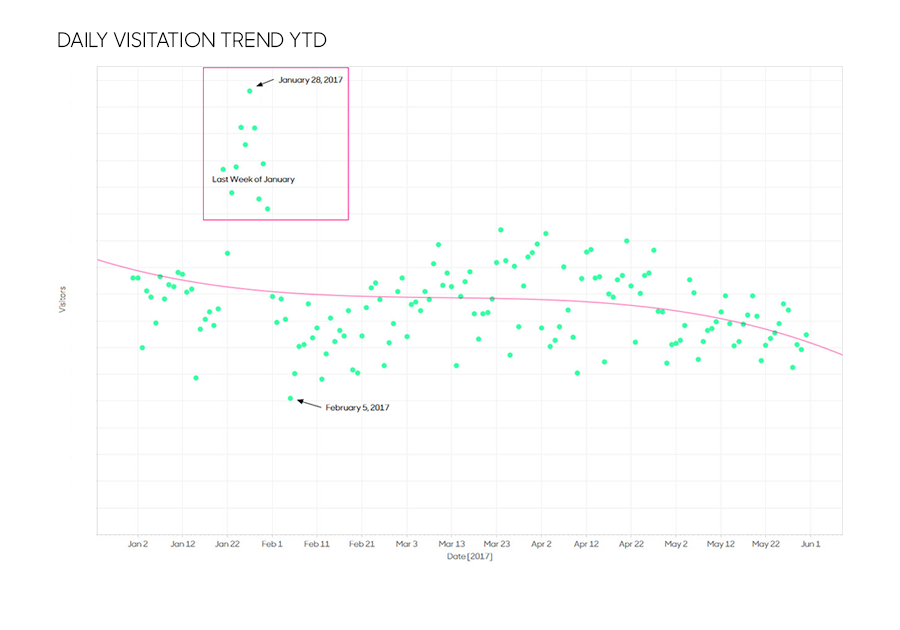
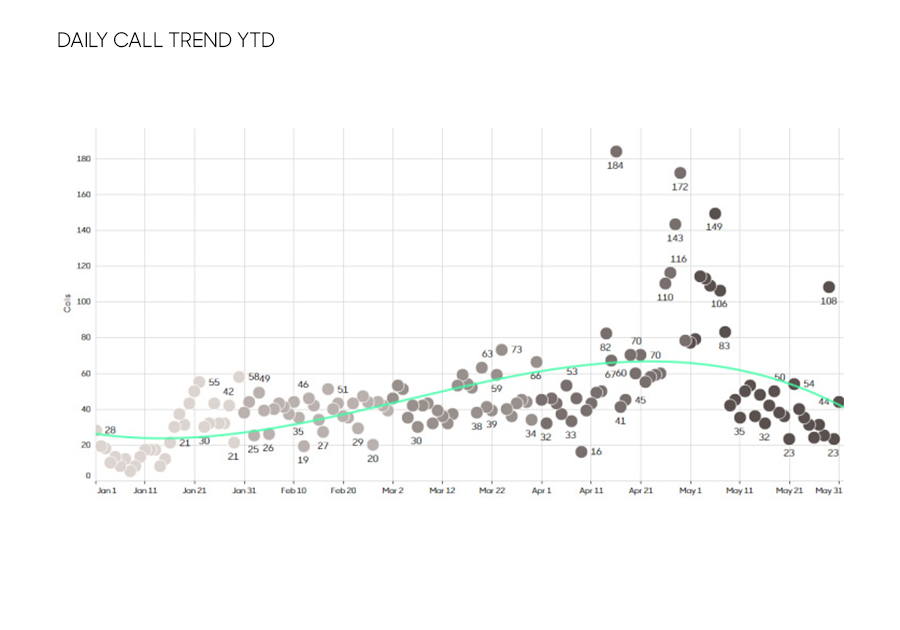
Below are some sample visuals from Tableau. To maintain the confidentiality of the data, these are just representations which don't really do the effort justice.
BI Competency
HIGHLY COMPETENT MANAGER
My experience in both Tableau and DOMO, as well as Power BI in systems review, has shown me that the principles and foundation for these visualization tools is essentially the same, with varying levels of functionality and UX. I'm highly confident in my ability to quickly adapt to any BI system for data connection and analysis.
My overall understanding of BI systems hands-on is a great base for managing data science processes of professional engineers and analysts, allowing me to apply my primary skillset of steering the analytics with business logic to achieve insights.